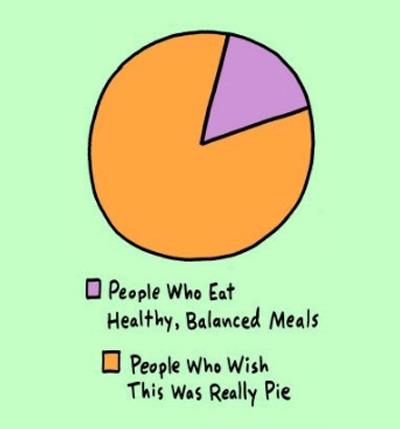
You attend your first ever 401k meeting….and they hand you some pie charts.
Oh, no.
First of all, I should say I love pie. Especially apple pie.
But I hate generic pie charts in retirement plan books.
I can’t tell you the number of boring-ass financial meetings I’ve attended where some dude in a suit is plowing through a bunch of pie charts while his clients pretend to be awake.
Rule one of asset allocation: Chuck the pie chart.
Most of the time, these charts are based on your age and risk tolerance. Nothing like putting a few square pegs in round holes, huh? I’m sure yours will fit just nicely into this….oh, wait, it won’t fit? Let’s just
Jam it home.
What about your goal? What about “How much do I really need my money to earn?”
Nope.
Asset allocation, or (to use the five dollar word) “diversification”, starts with what you want for yourself, doesn’t it? Don’t you think you should try to achieve your real goal?
So, here’s the rocket science of 401k planning:
1) Write down what you want. I know that may seem like a shock to you. The National Endowment for Financial Education (NEFE), The Financial Industry Regulatory Authority (FINRA), the Securities and Exchange Commission (SEC) and the College for Financial Planning (FPA) all recommend starting with your goal.
You want to use a generic pie chart instead?
Good luck with that the next time the market drops.
2) Here’s the next amazing step: read through different types of investments to see which ones actually have historically met your goal. I think my head just exploded. Really? Who thought that you could actually look back at investments and see what they’ve accomplished?
Some thoughts:
Gold and Collectibles: Good for people who can actually predict the future. Ms. Cleo and Nostradamus should have loaded up. Gold is five times more volatile than the stock market. Think you know where it’s headed? Think again. (This doesn’t mean I don’t like gold. It means that you can’t tell me it’s going to be through the roof in three years, moron on Twitter…..).
Stocks: This is like saying that you should always have cake after dinner, but generally, ten years or more and you’re looking good with stocks. If you need the money next year, you’ve done about as well at the casino.
Bonds: Depending on the type, over five years.
….and so on.
Get the point? Real diversification, dear readers, is going to be based on your personal end-game. Start there. Or not. Avoid pie charts, but load up on pie. Yum.

But, everything looks better in a pie chart!
I assume most people invest and save for retirement because “that’s what you’re supposed to do.” I also assume that your simple idea (you thought of it, right?) of establishing a goal leads to much better results. I would love to see a study (I’m sure it exists) that examines the success rate between people who save towards a goal and people who save just to save.
Me too! I can’t fathom how to quantify that, and it’d take forever to complete the exercise….but that’d be fantastic. It was only my experience with a few hundred clients that brought me to the conclusion (borrowed from someone else!) that having a clear goal worked better. I’d love a bigger sample size.
Your pie chart was funny, I like pizza pie. 🙂 Seriously, I love making pie charts I remember during my college years one of my favorite things to do is to make charts, for me, it’s easier to explain and understand the thing that you want to discuss.
Exactly! That’s why I think so many people are drawn to pie charts….because they’re fun. Using a pie chart to choose 401k funds, though? That could be costly.
I like the little pie chart at the top of my Vanguard account. Can’t I partake in both types of pie?
Funny. Looking at the pie chart is fine. Dividing your money according to a pre-arranged pie chart based on a static “risk tolerance” is absolutely silly.
Pie charts are used so often it gets frustrating. They don’t tell you very much (ie exact numbers) and they are really meant to just dumb the data down, I think. I do create goals, crunch numbers, and if I really want a pretty visual, I’ll make a pie chart after I’ve done all the heavy lifting and dirty work. You gotta admit – they are good looking 😉
“Avoid pie charts, but load up on pie.” Hmmm. I’ll keep that in mind.